Overview
Vonto is an app that connects to business tools and generates insights from company data.
When I joined the project, the product had been in the market for around 18 months but was struggling with low engagement and retention. The team needed to better understand who the product should serve and what unique value it could deliver.
I was brought in to help the team revisit the product direction through research, prototyping, and testing.
Identifying the right customer
We began by stepping back from the existing product and looking again at the problem space.
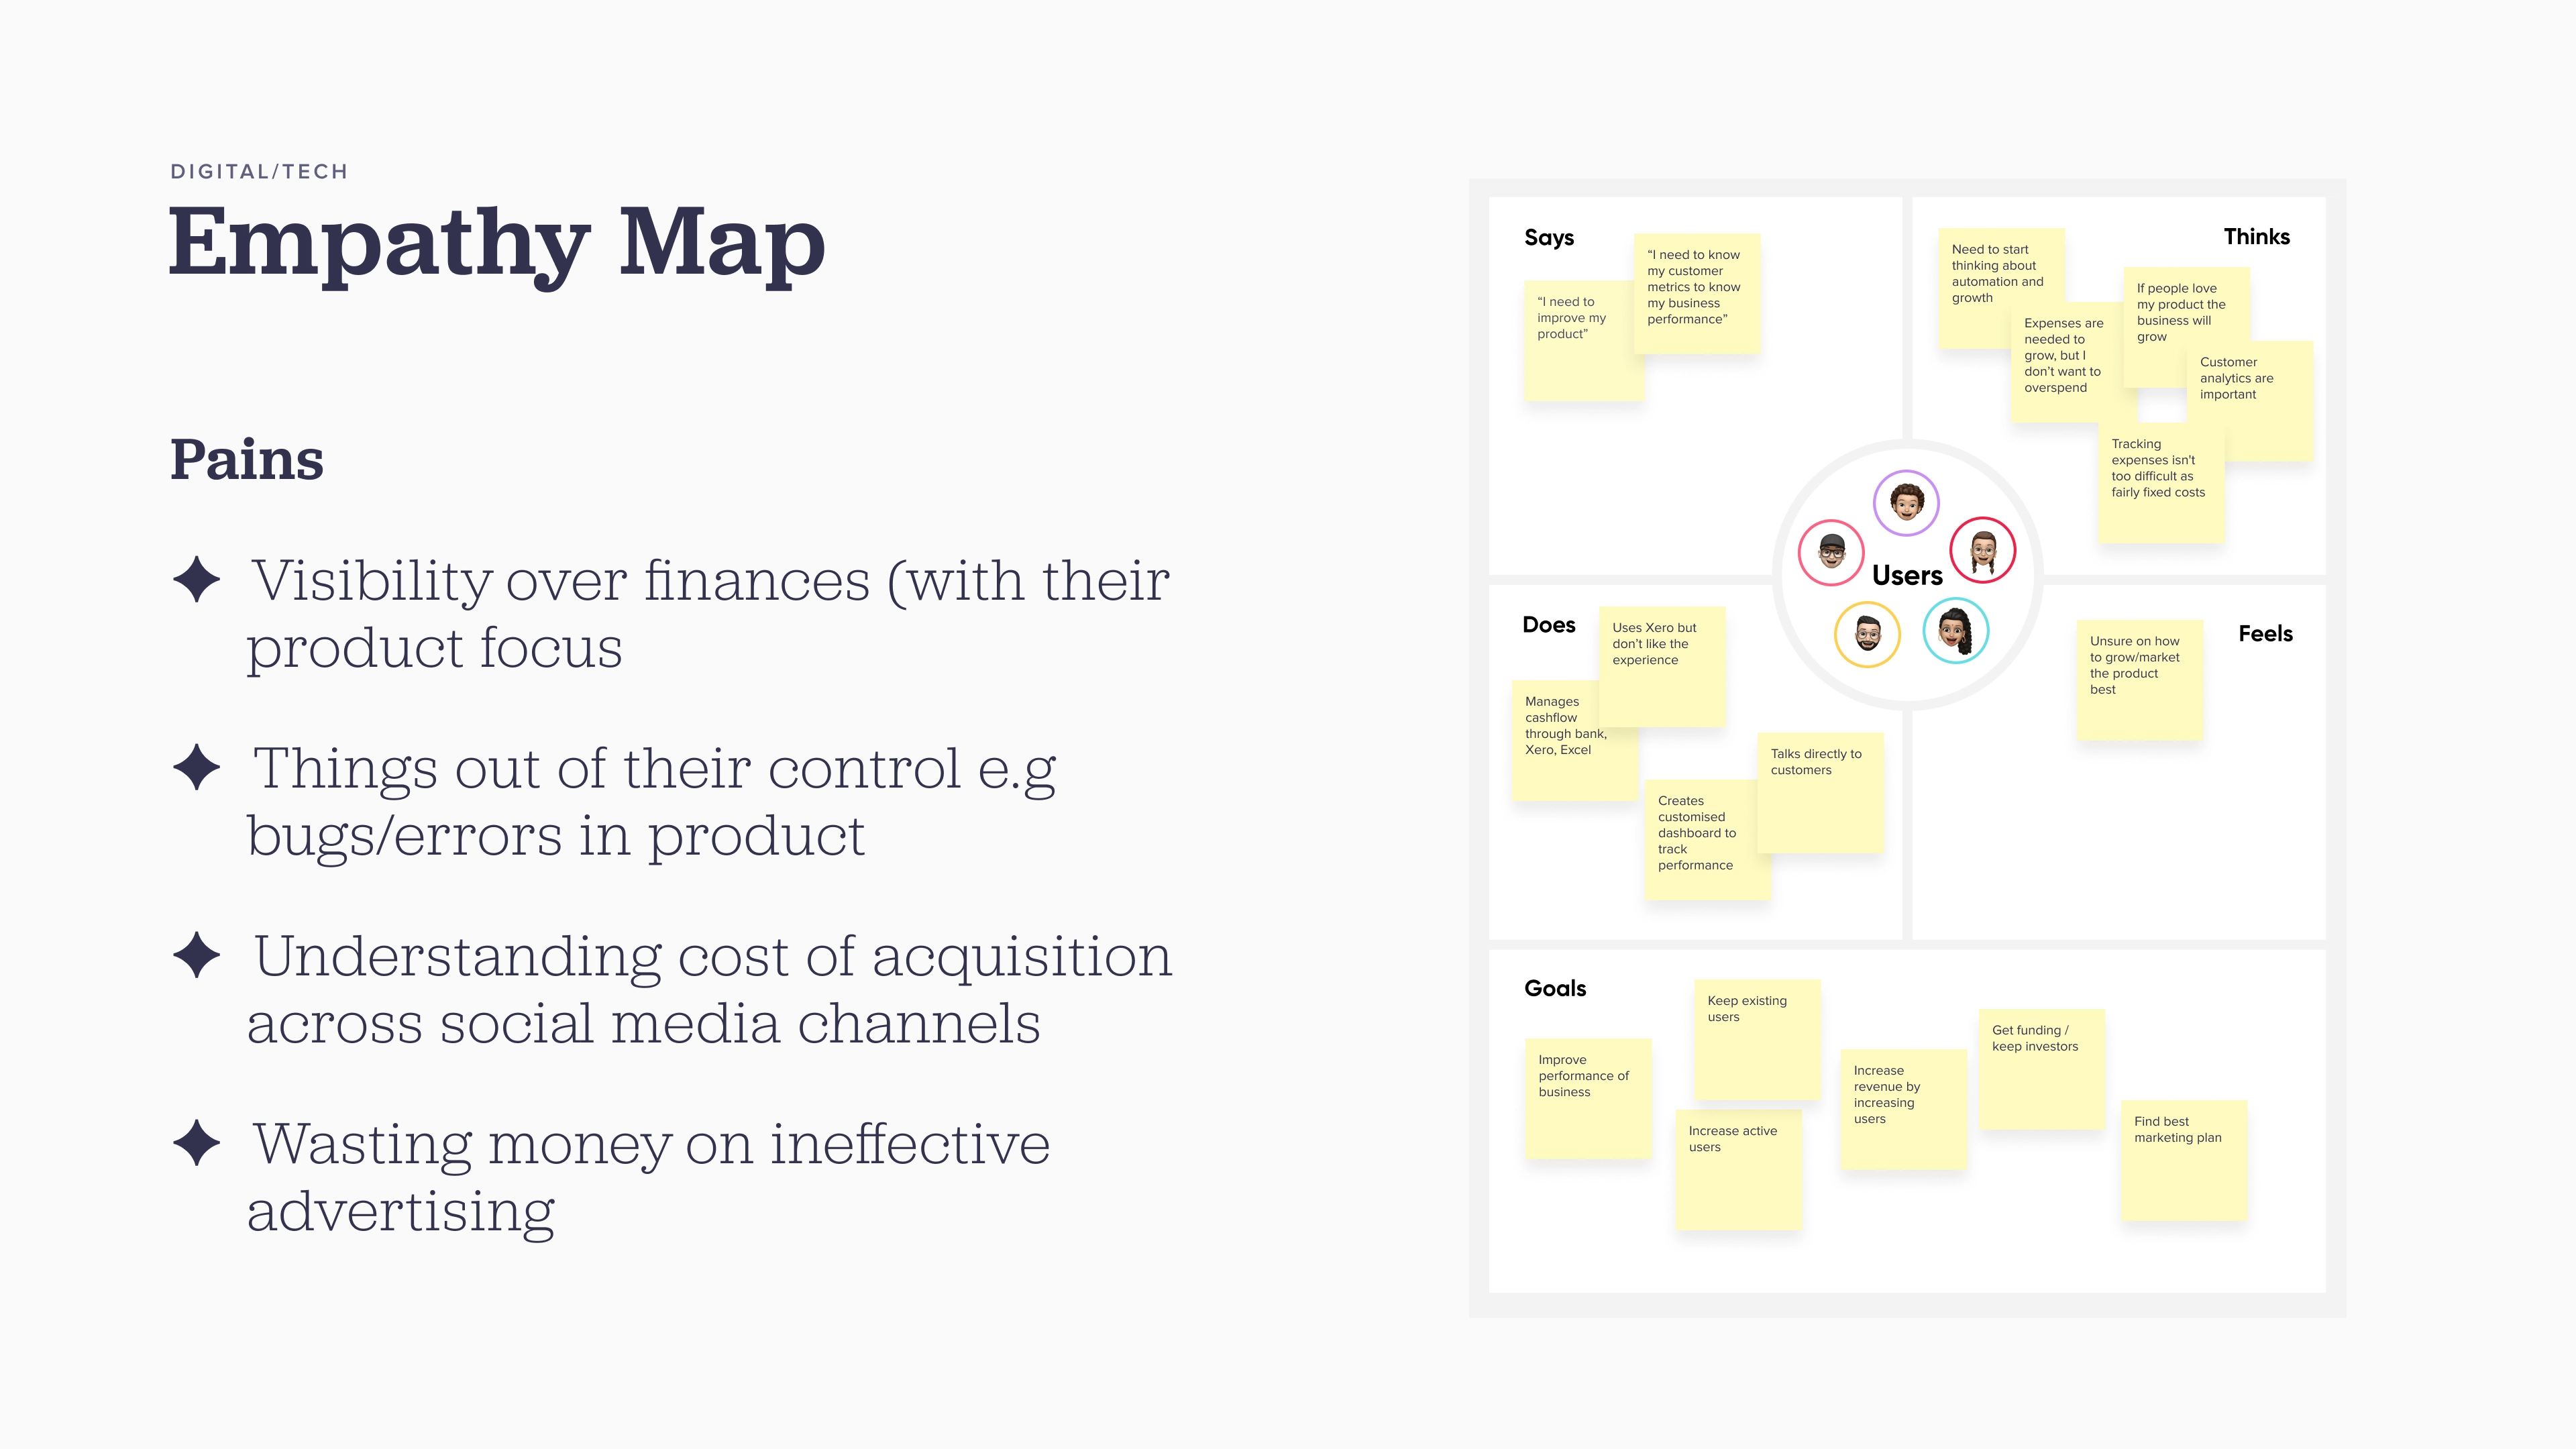
I led interviews with 15 small business owners across retail, hospitality, and tech startups to understand how they managed their business data and metrics.
Across industries, we saw a common pattern: businesses relied on many different tools, but understanding how those metrics related to each other often required exporting data into spreadsheets.
One segment stood out in particular: tech startup founders. Compared with other businesses, they relied heavily on SaaS tools and tracked a wide range of metrics, yet frequently described manually combining data to understand business performance.
This led us to pivot our exploration toward the tech startup market.
Testing potential directions
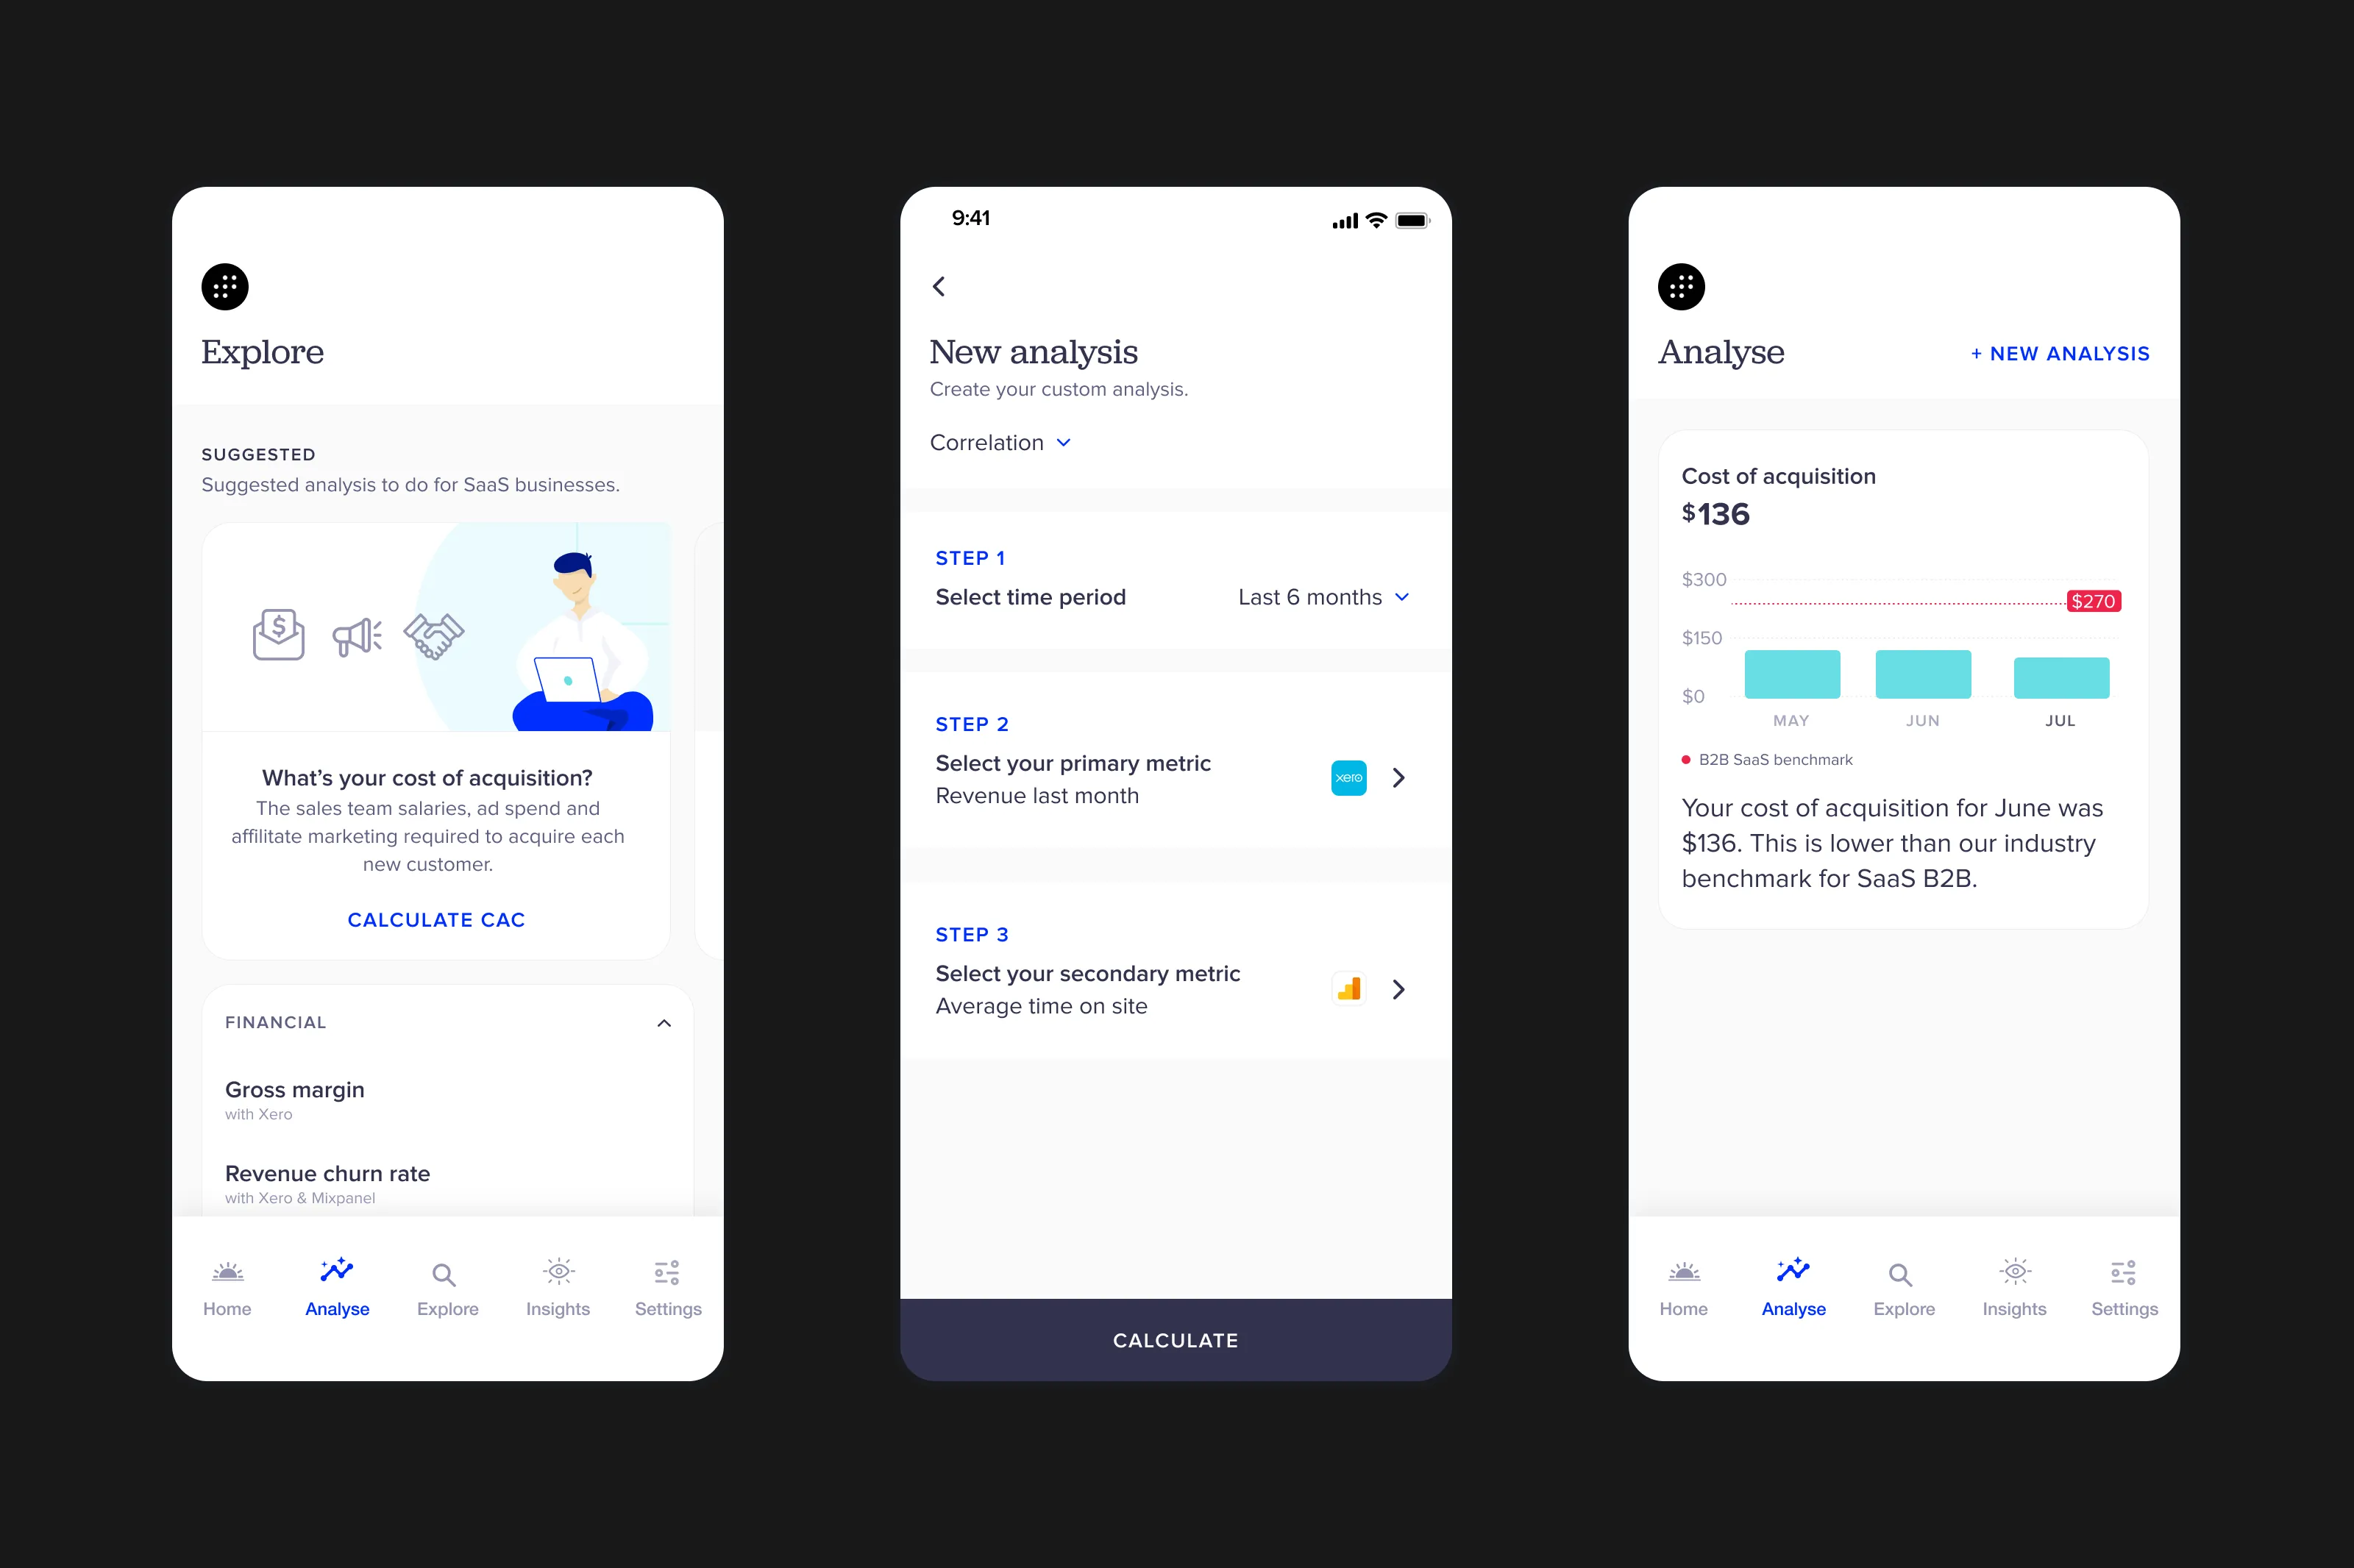
To explore how Vonto could best serve this audience, I led the design and prototyping of several product concepts, which we tested with founders in two rounds of interviews.
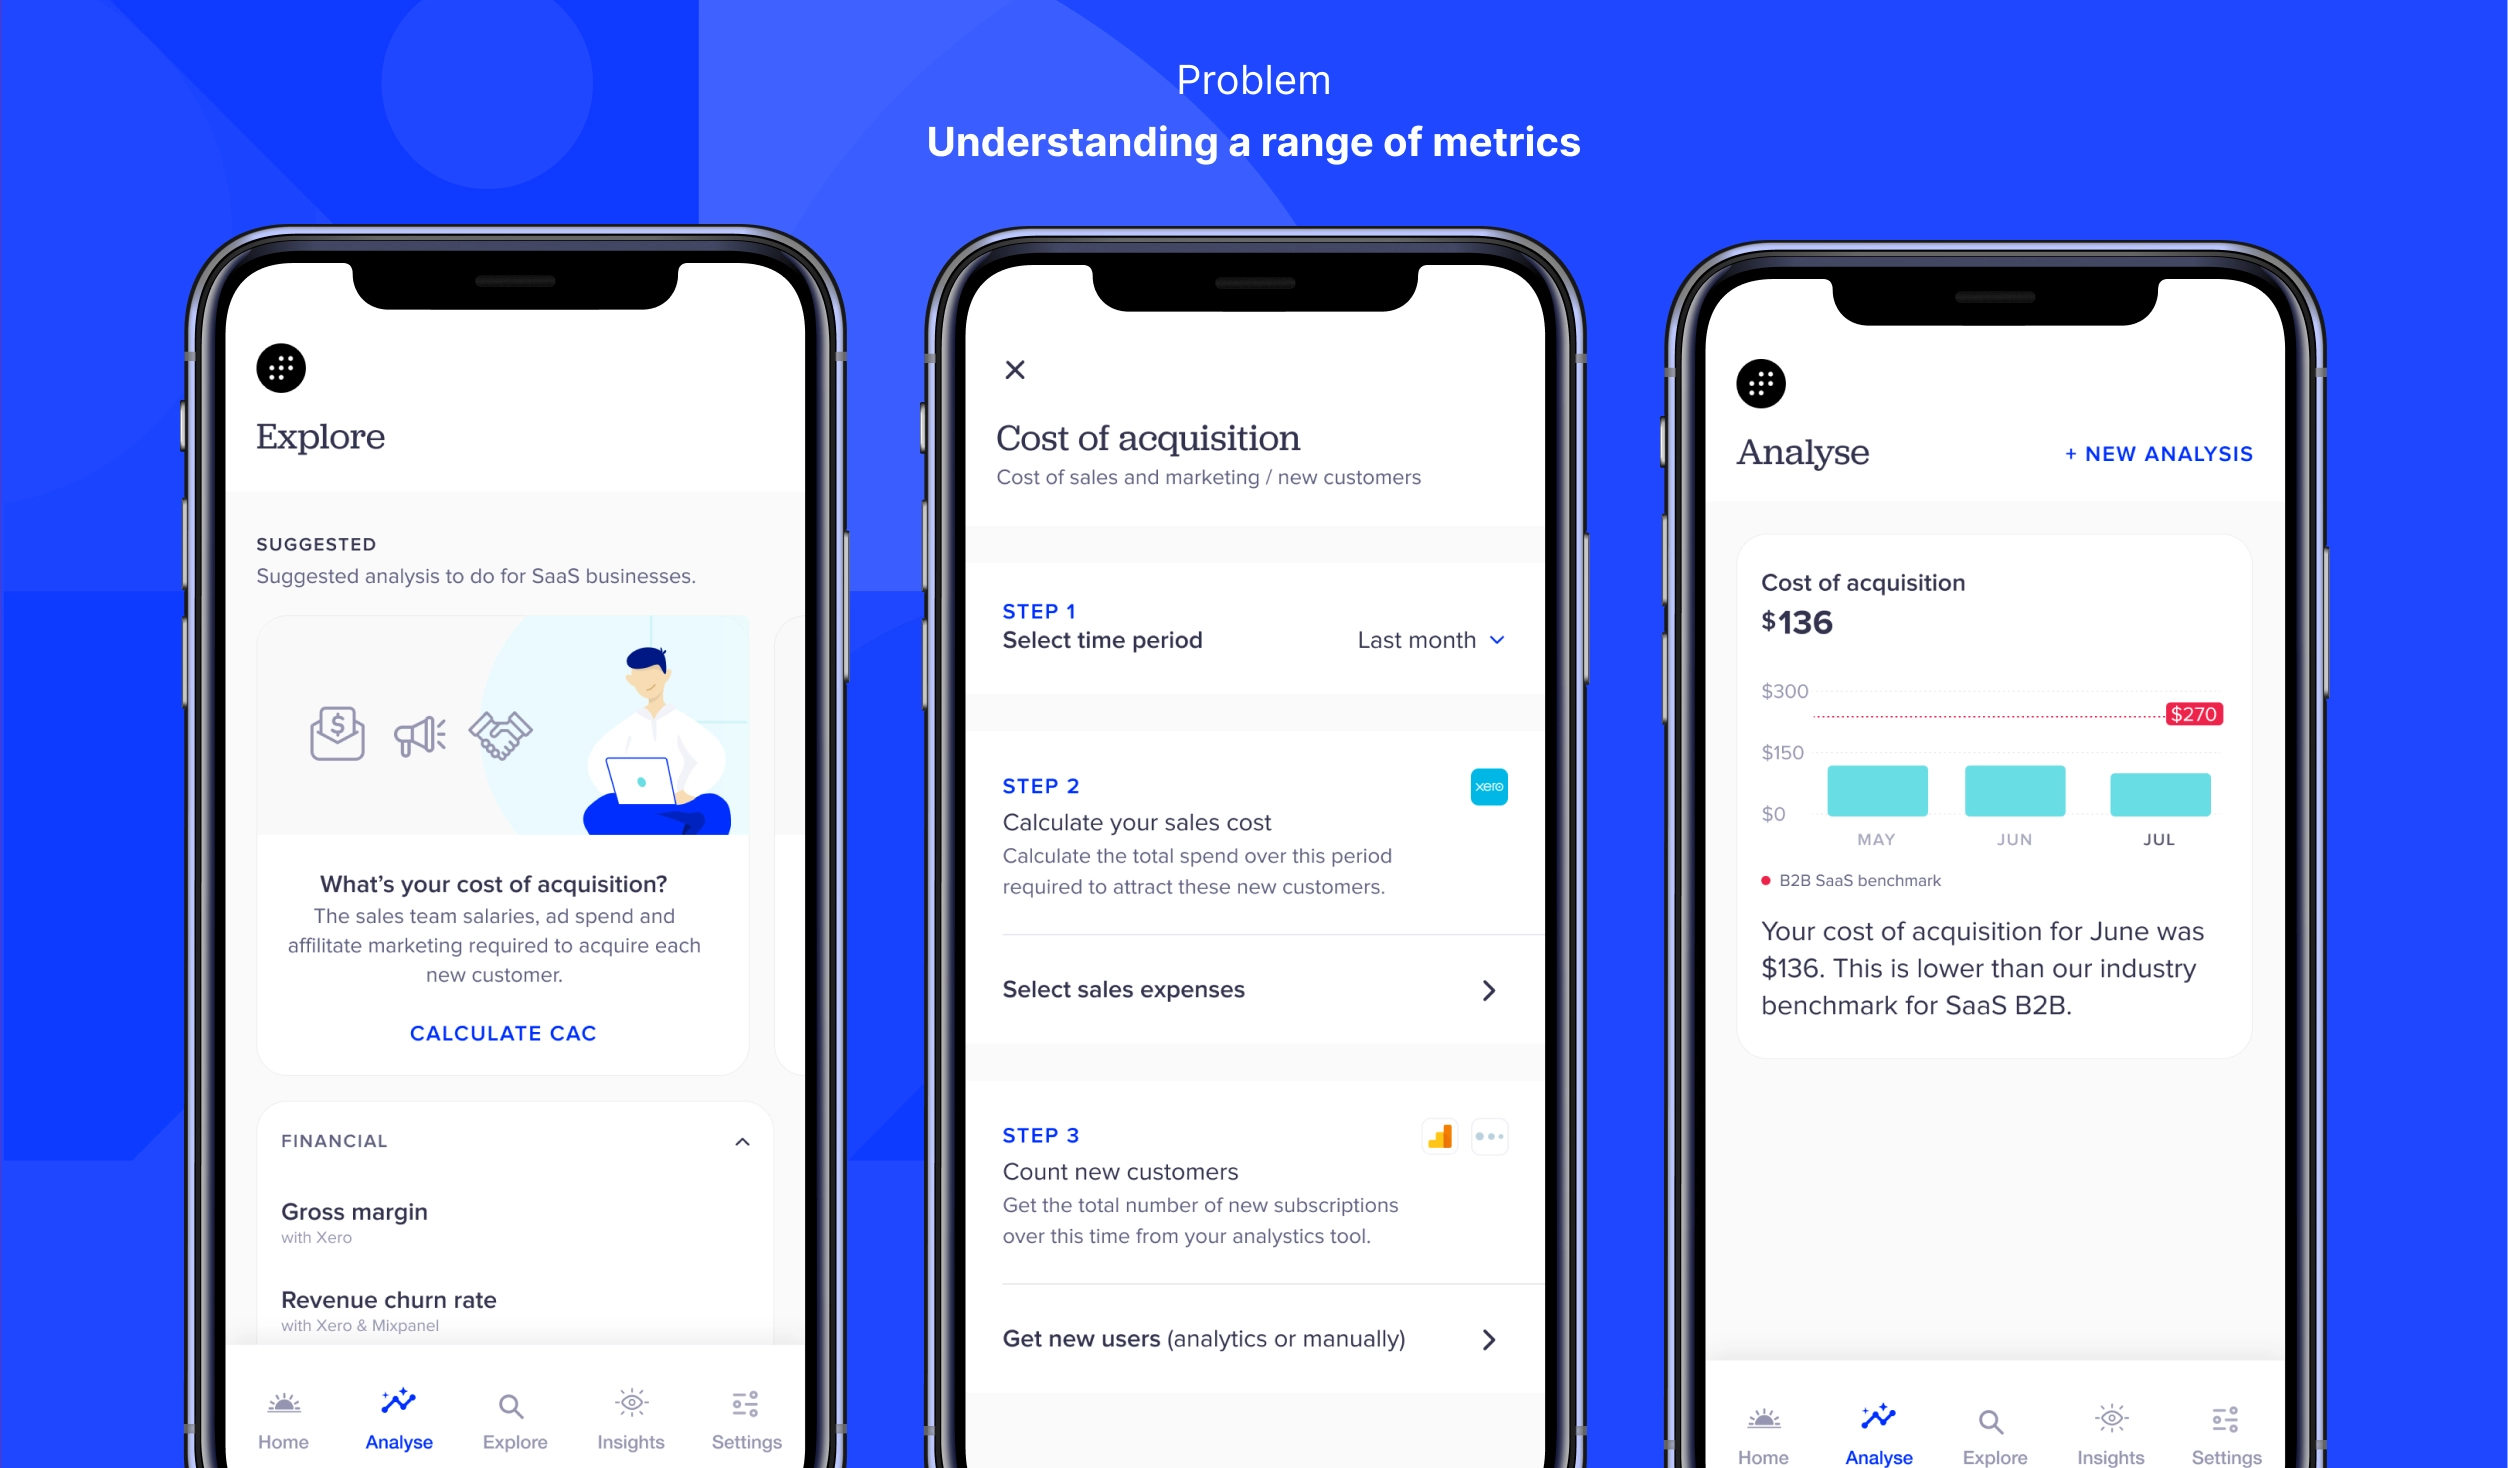
These concepts explored three main directions:
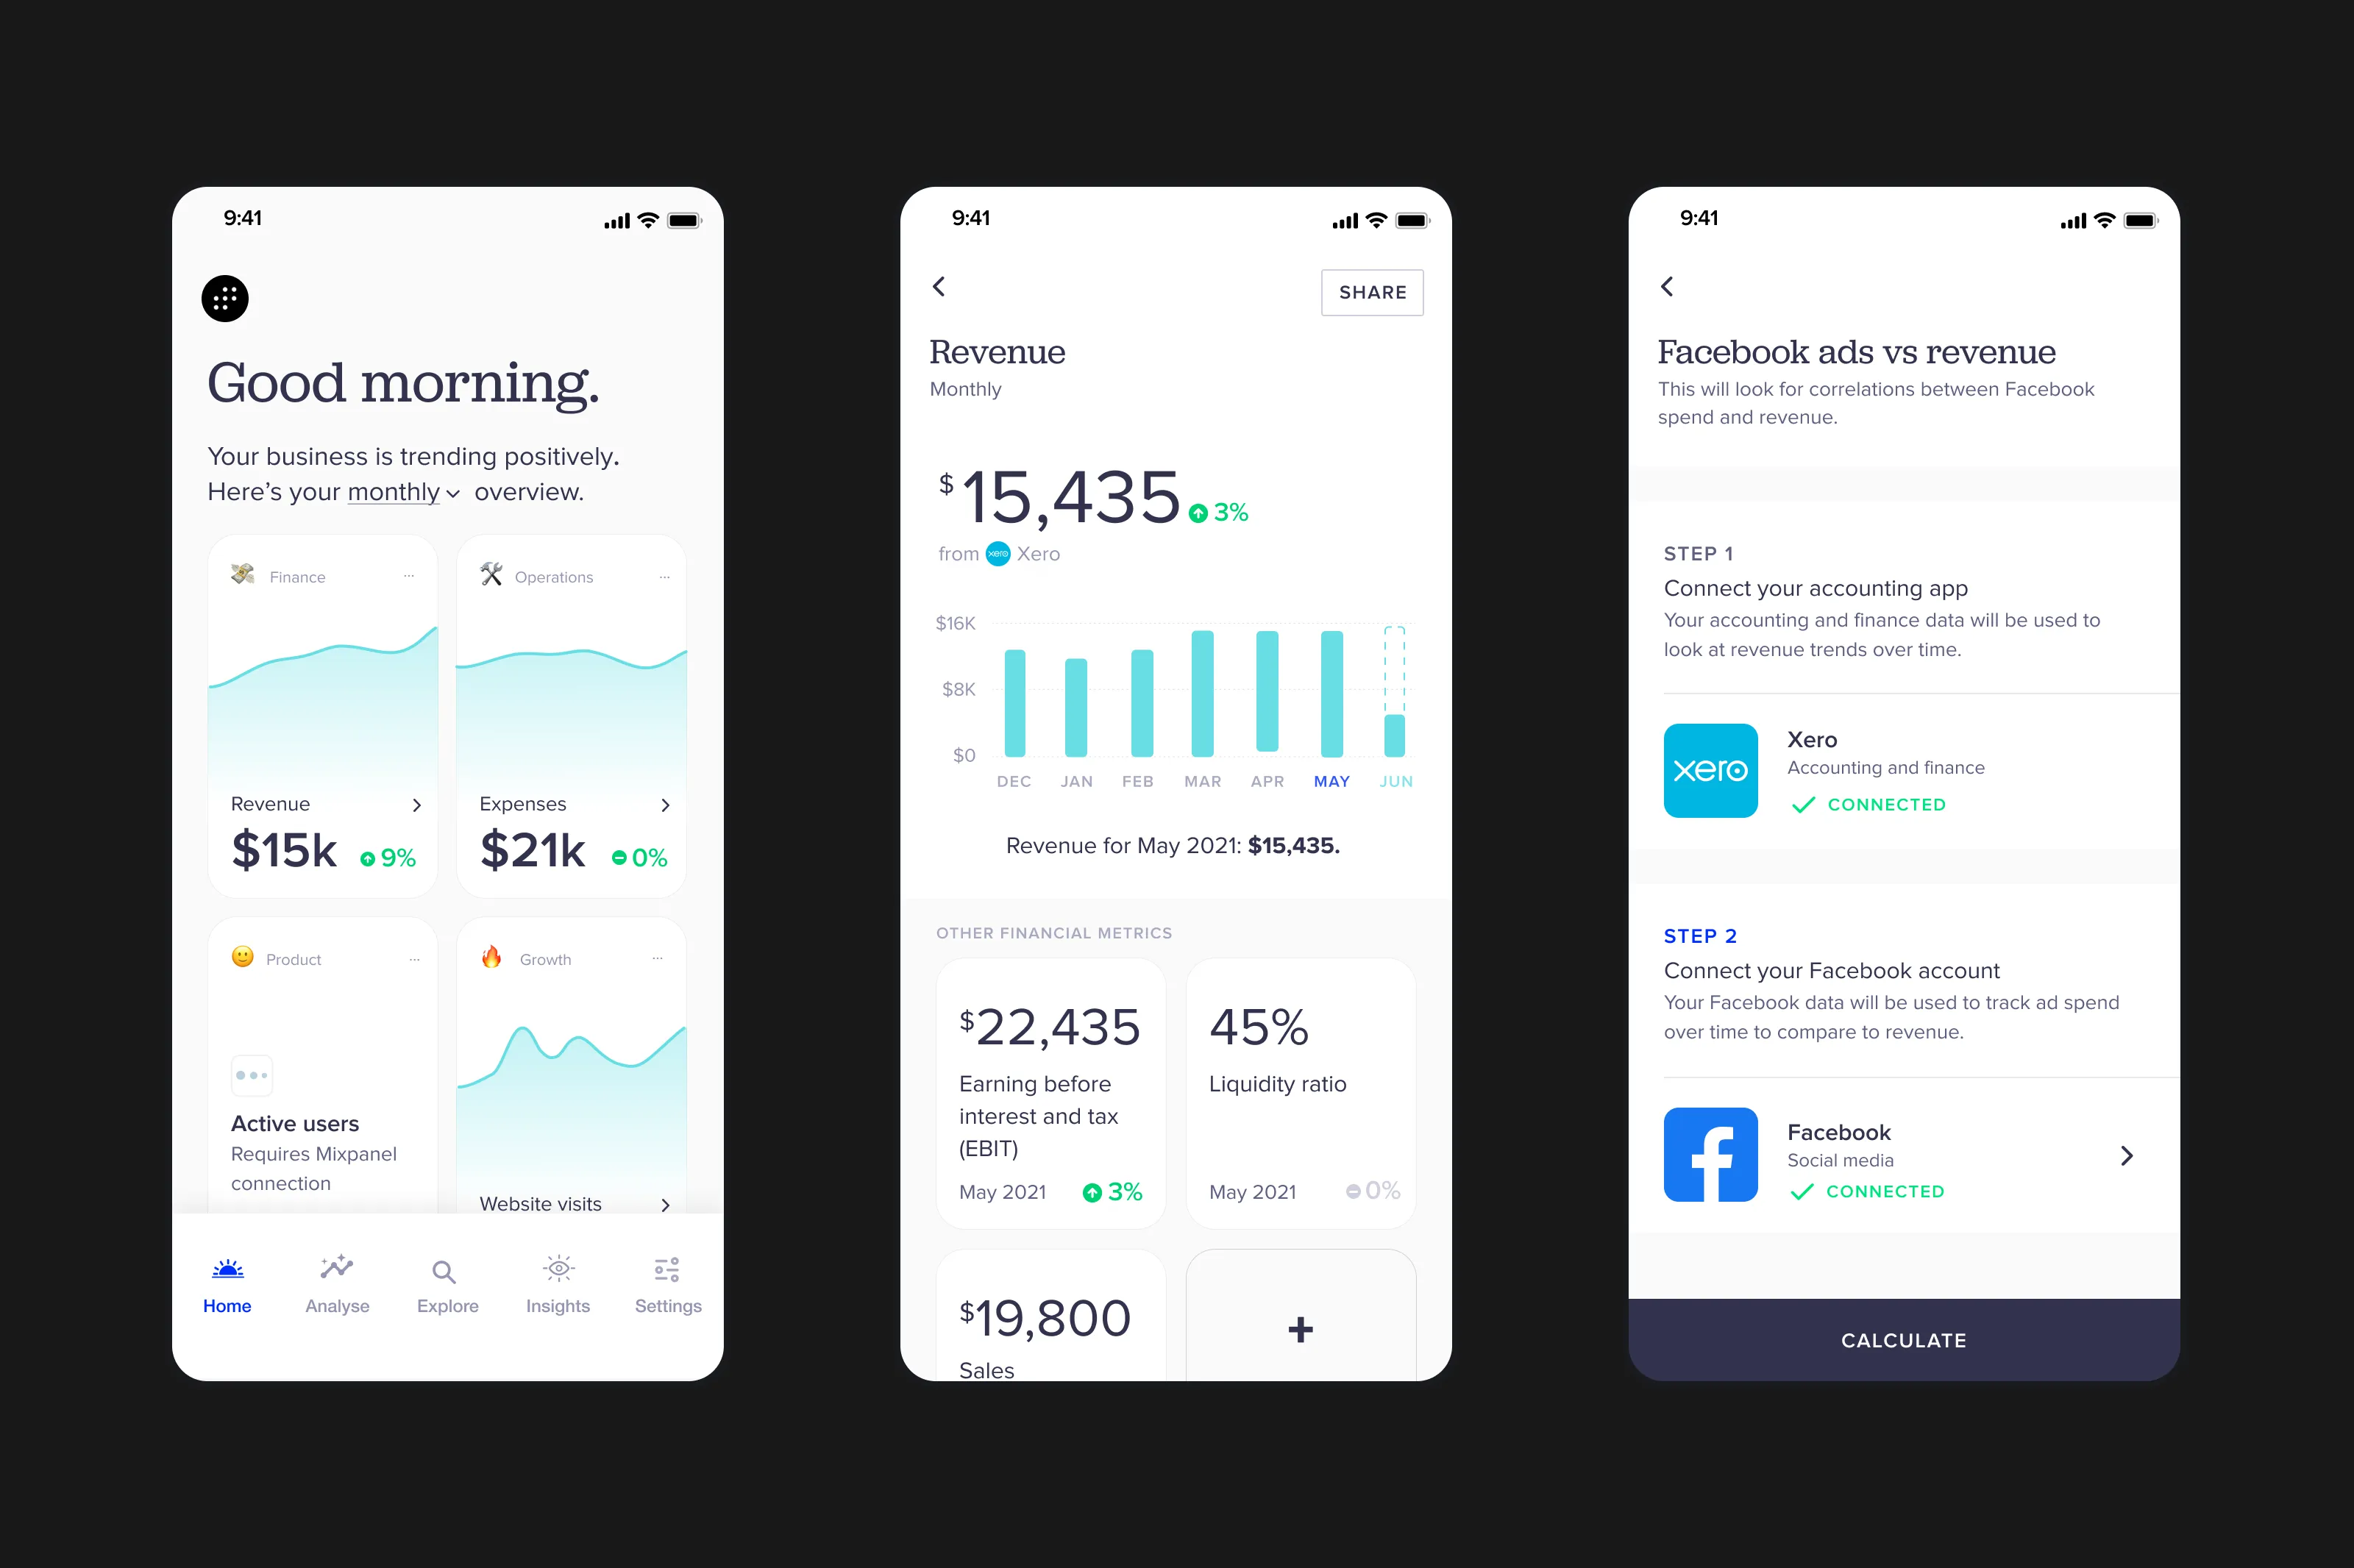
- Aggregating metrics across multiple platforms in a simple mobile dashboard (existing value prop)
- Simplifying more complex calculations like acquisition cost
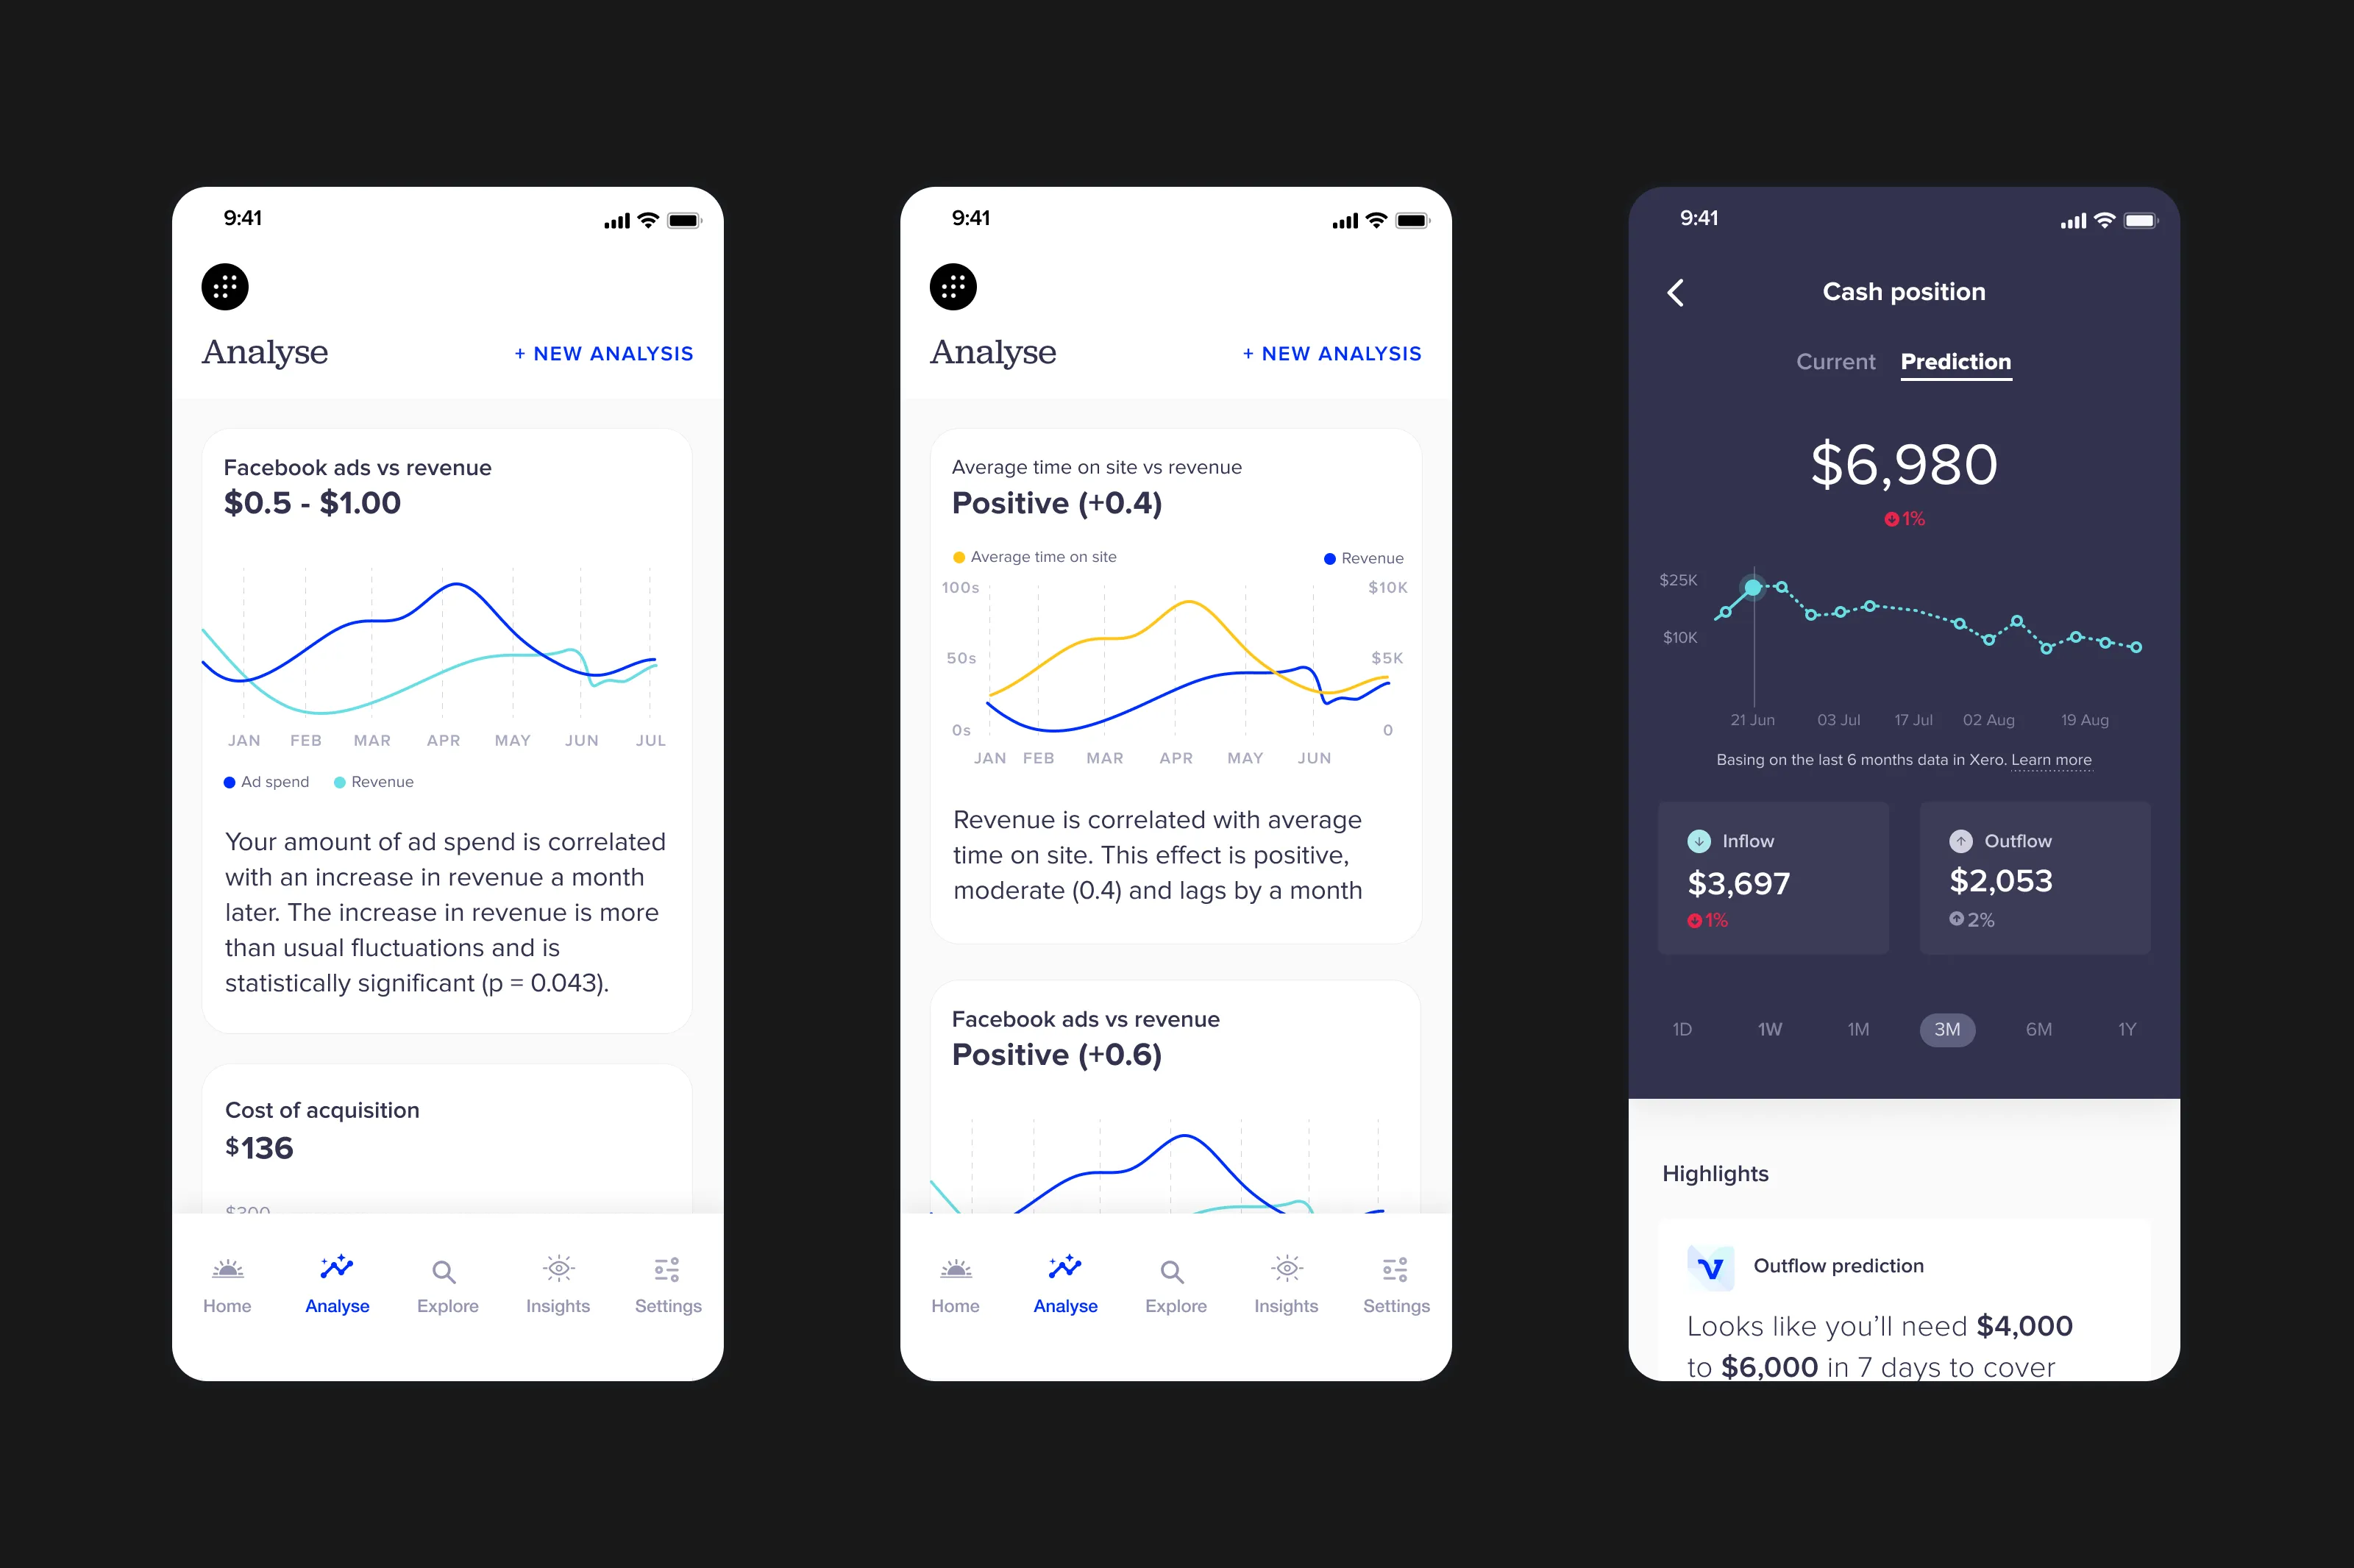
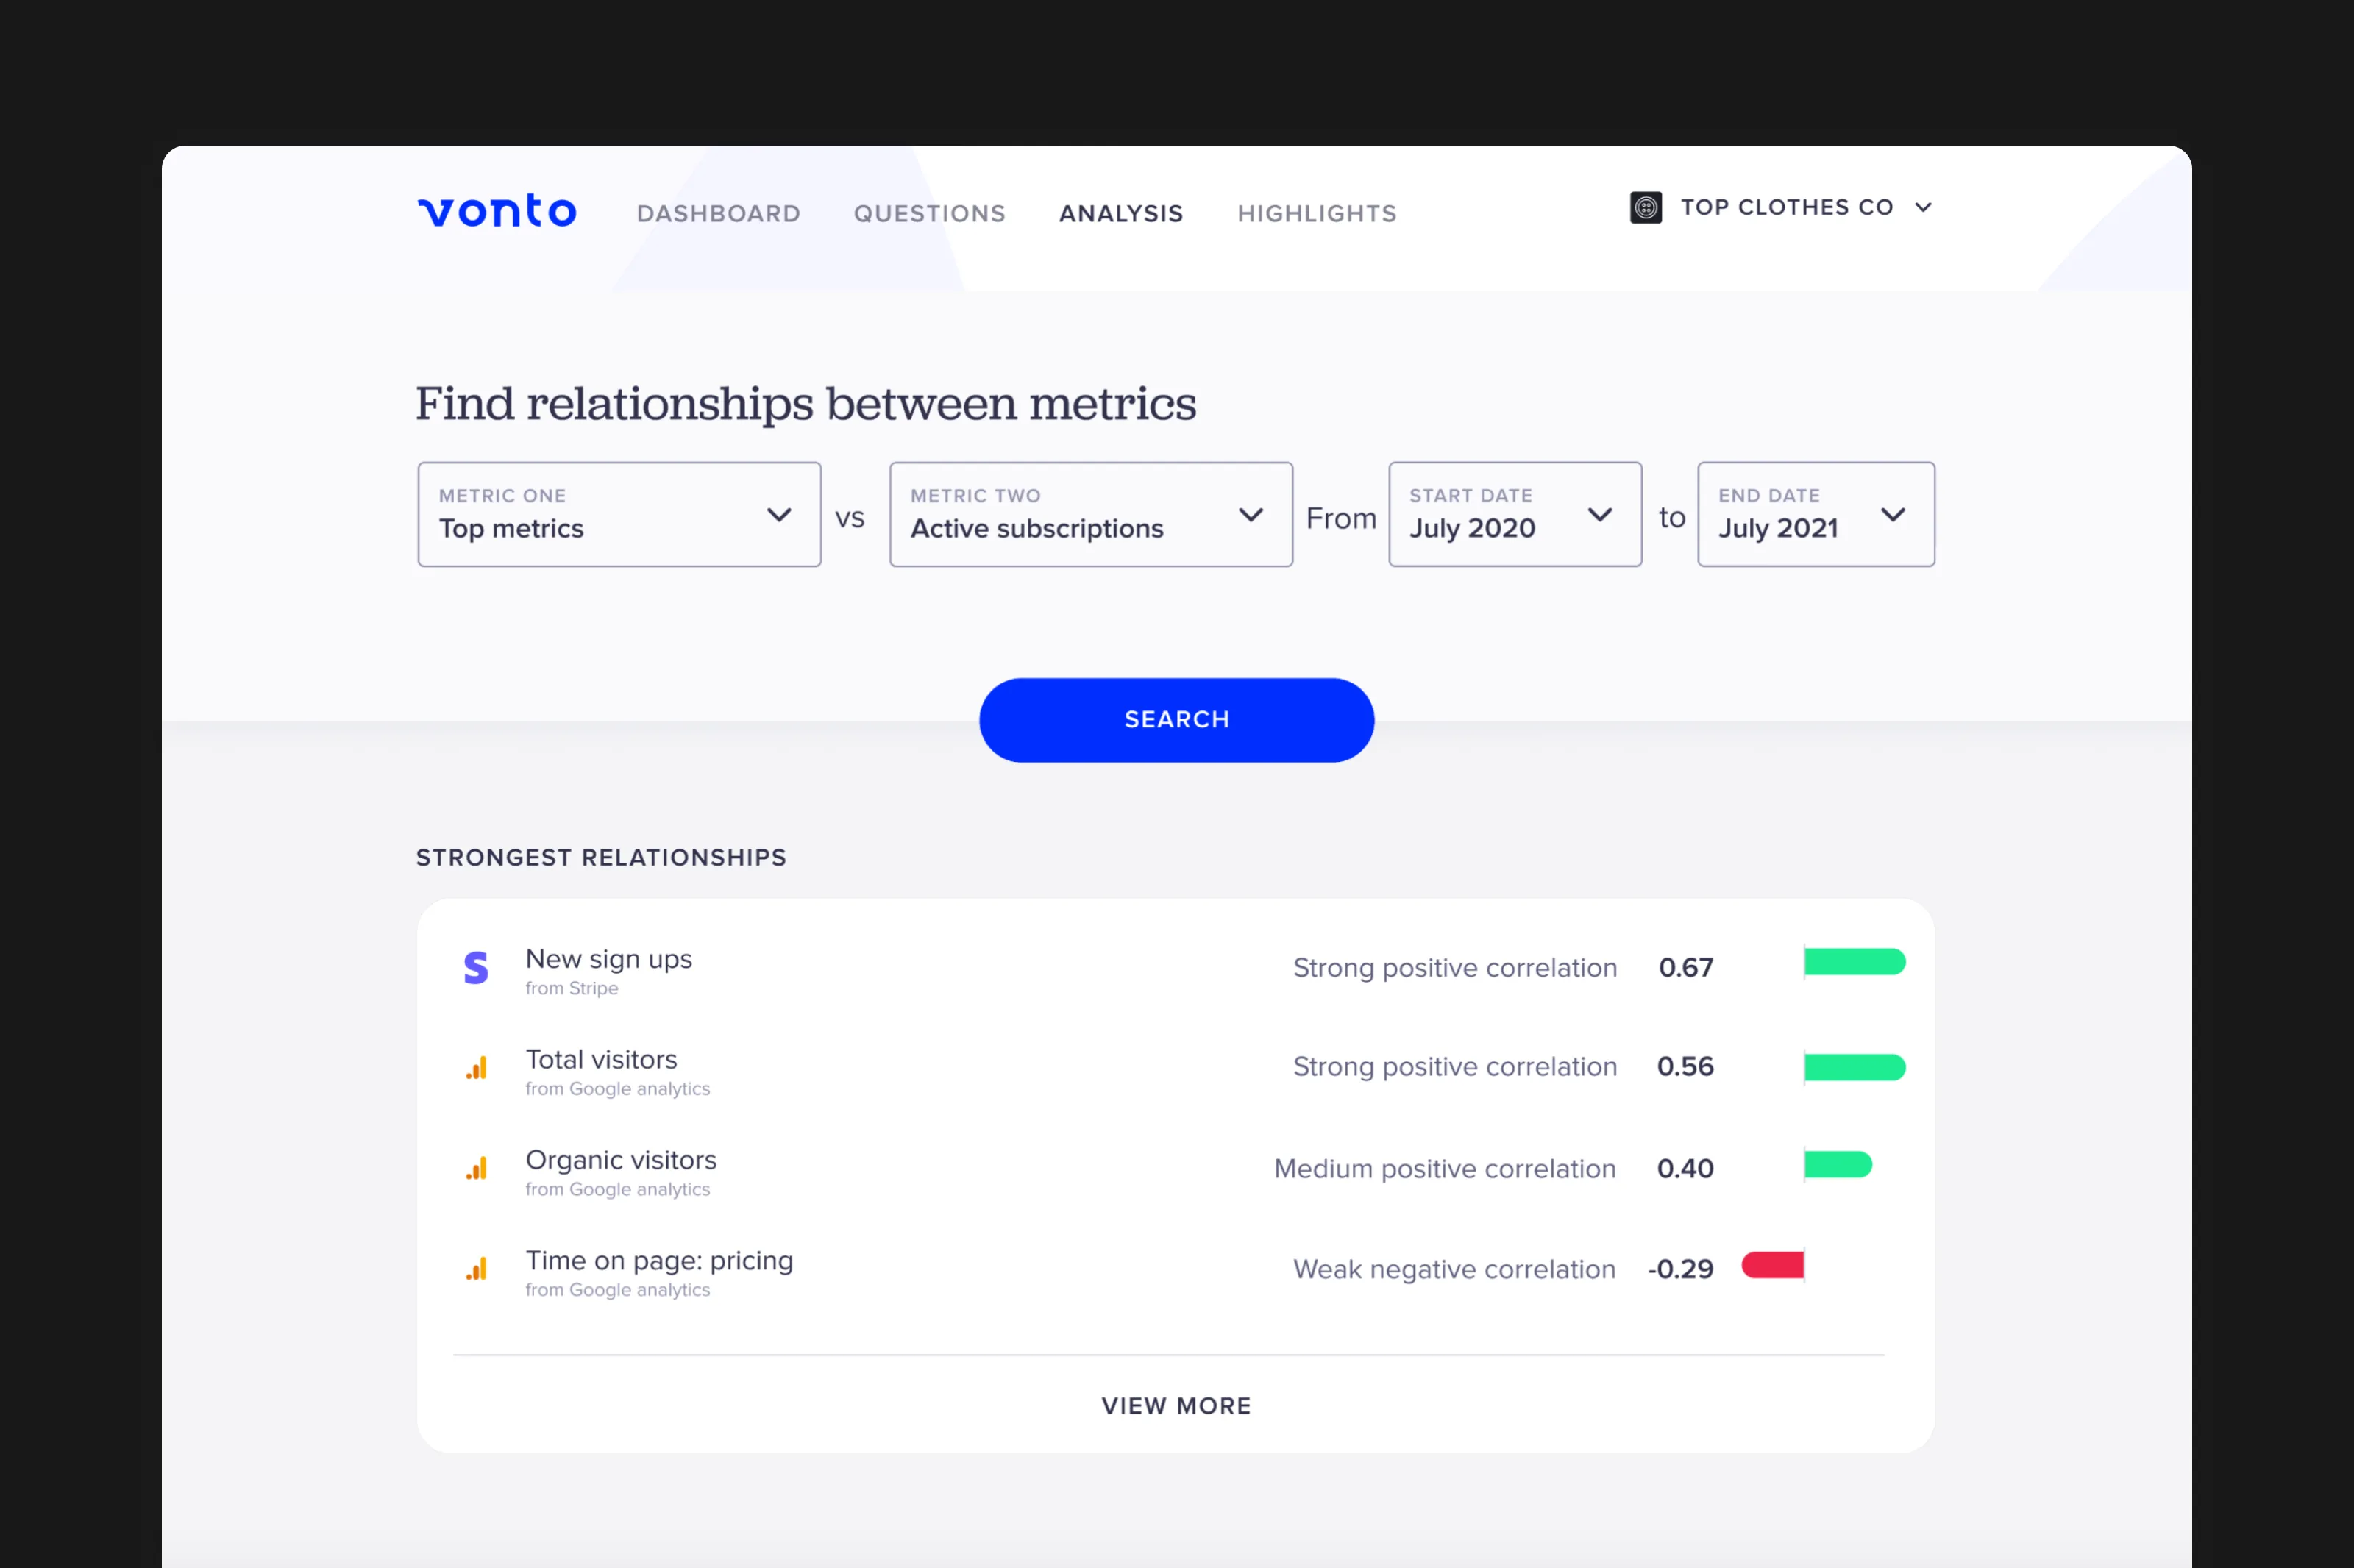
- Identifying correlations between metrics across tools
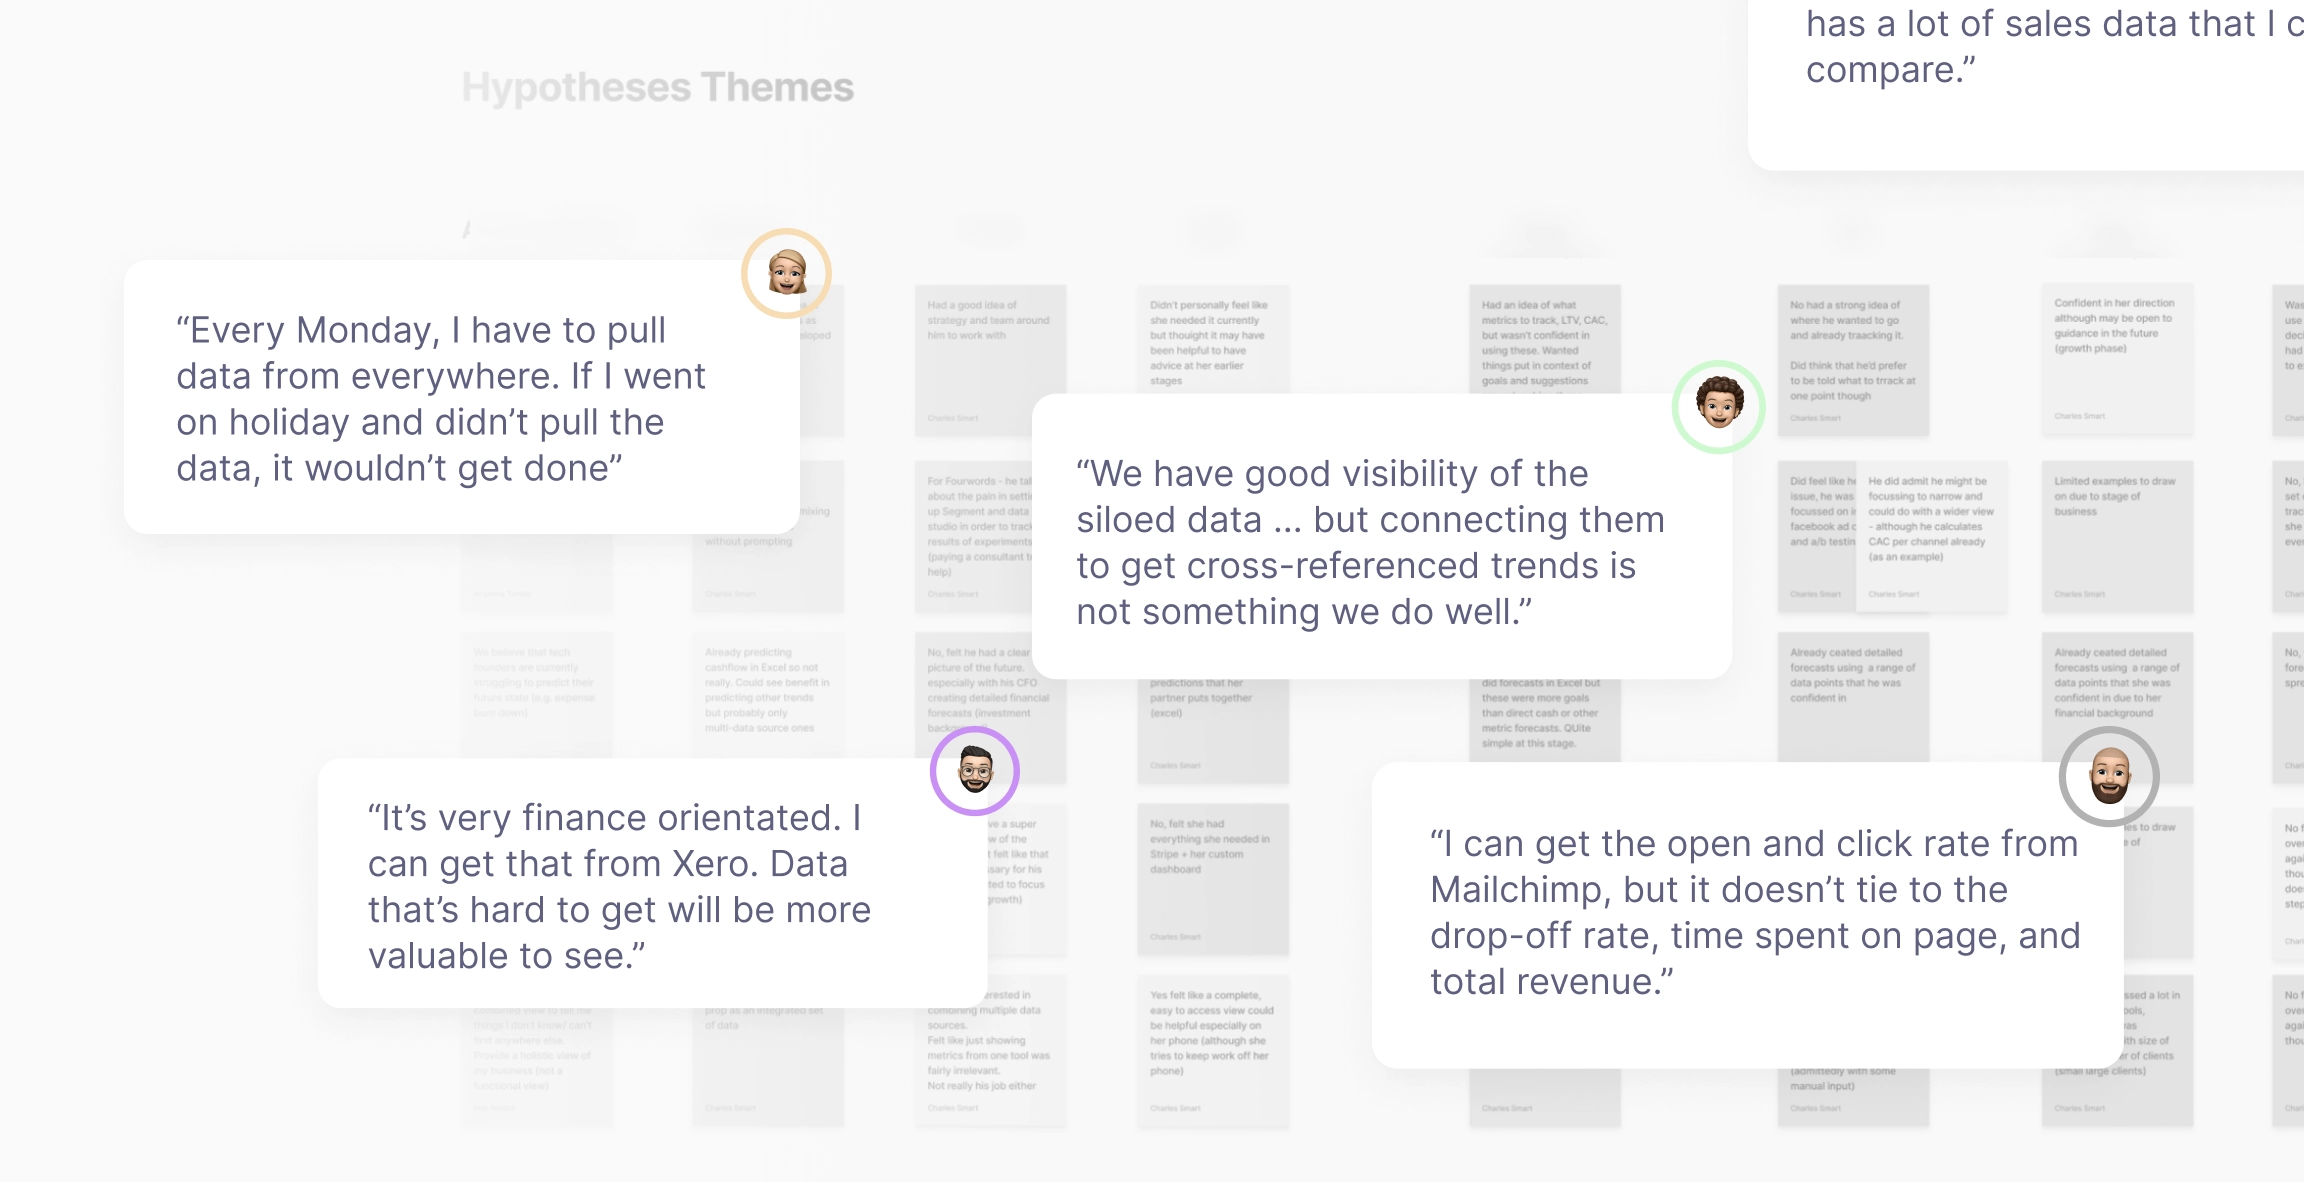
Testing revealed a pattern: Founders saw aggregated dashboards as nice-to-have, but they already trusted the dashboards in tools like Stripe, Xero, and analytics platforms.
However, they consistently described manually combining data in spreadsheets to answer more complex business questions.
This pointed to the bigger opportunity: helping founders generate insights that could only emerge by combining data from multiple apps.
Refining a new Vonto
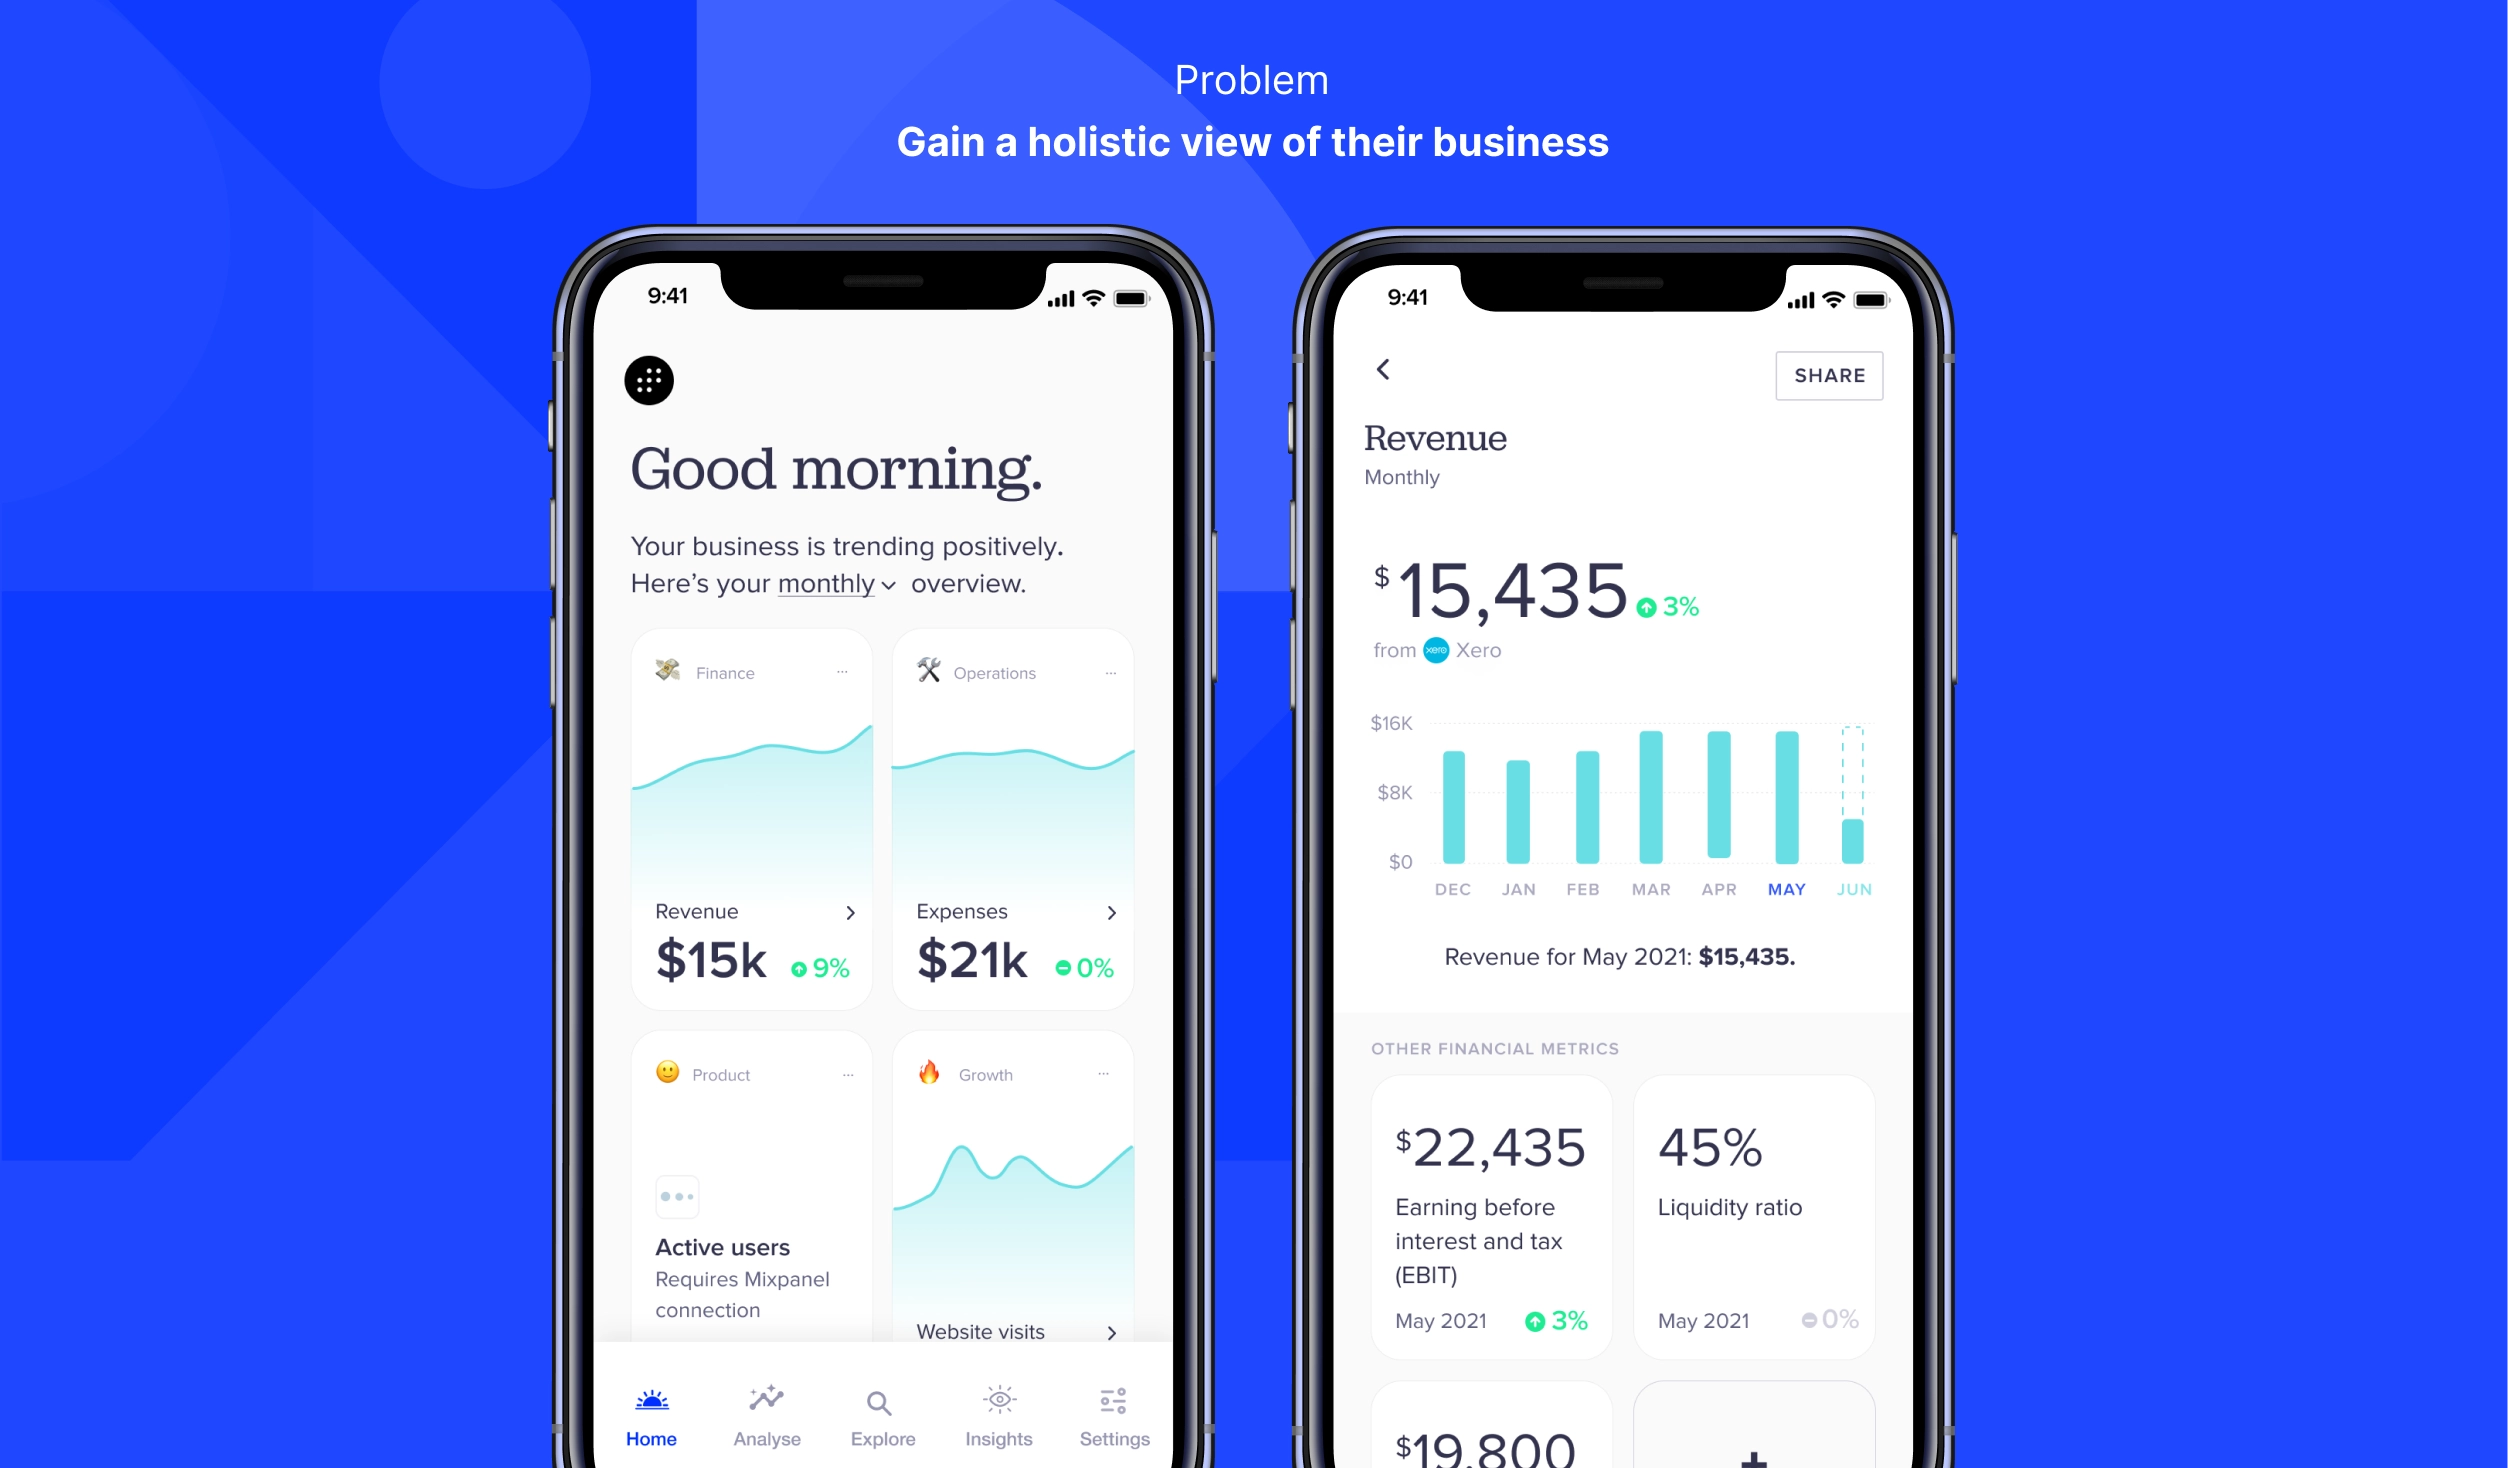
We now knew Vonto needed to deliver unique business insights by combining multiple tools. This needed to be in a simple form factor, and proactive in surfacing insights. Not another tool for founders to learn, but a replacement for haphazard spreadsheets, good enough to indicate when things were going well, and when things needed attention.
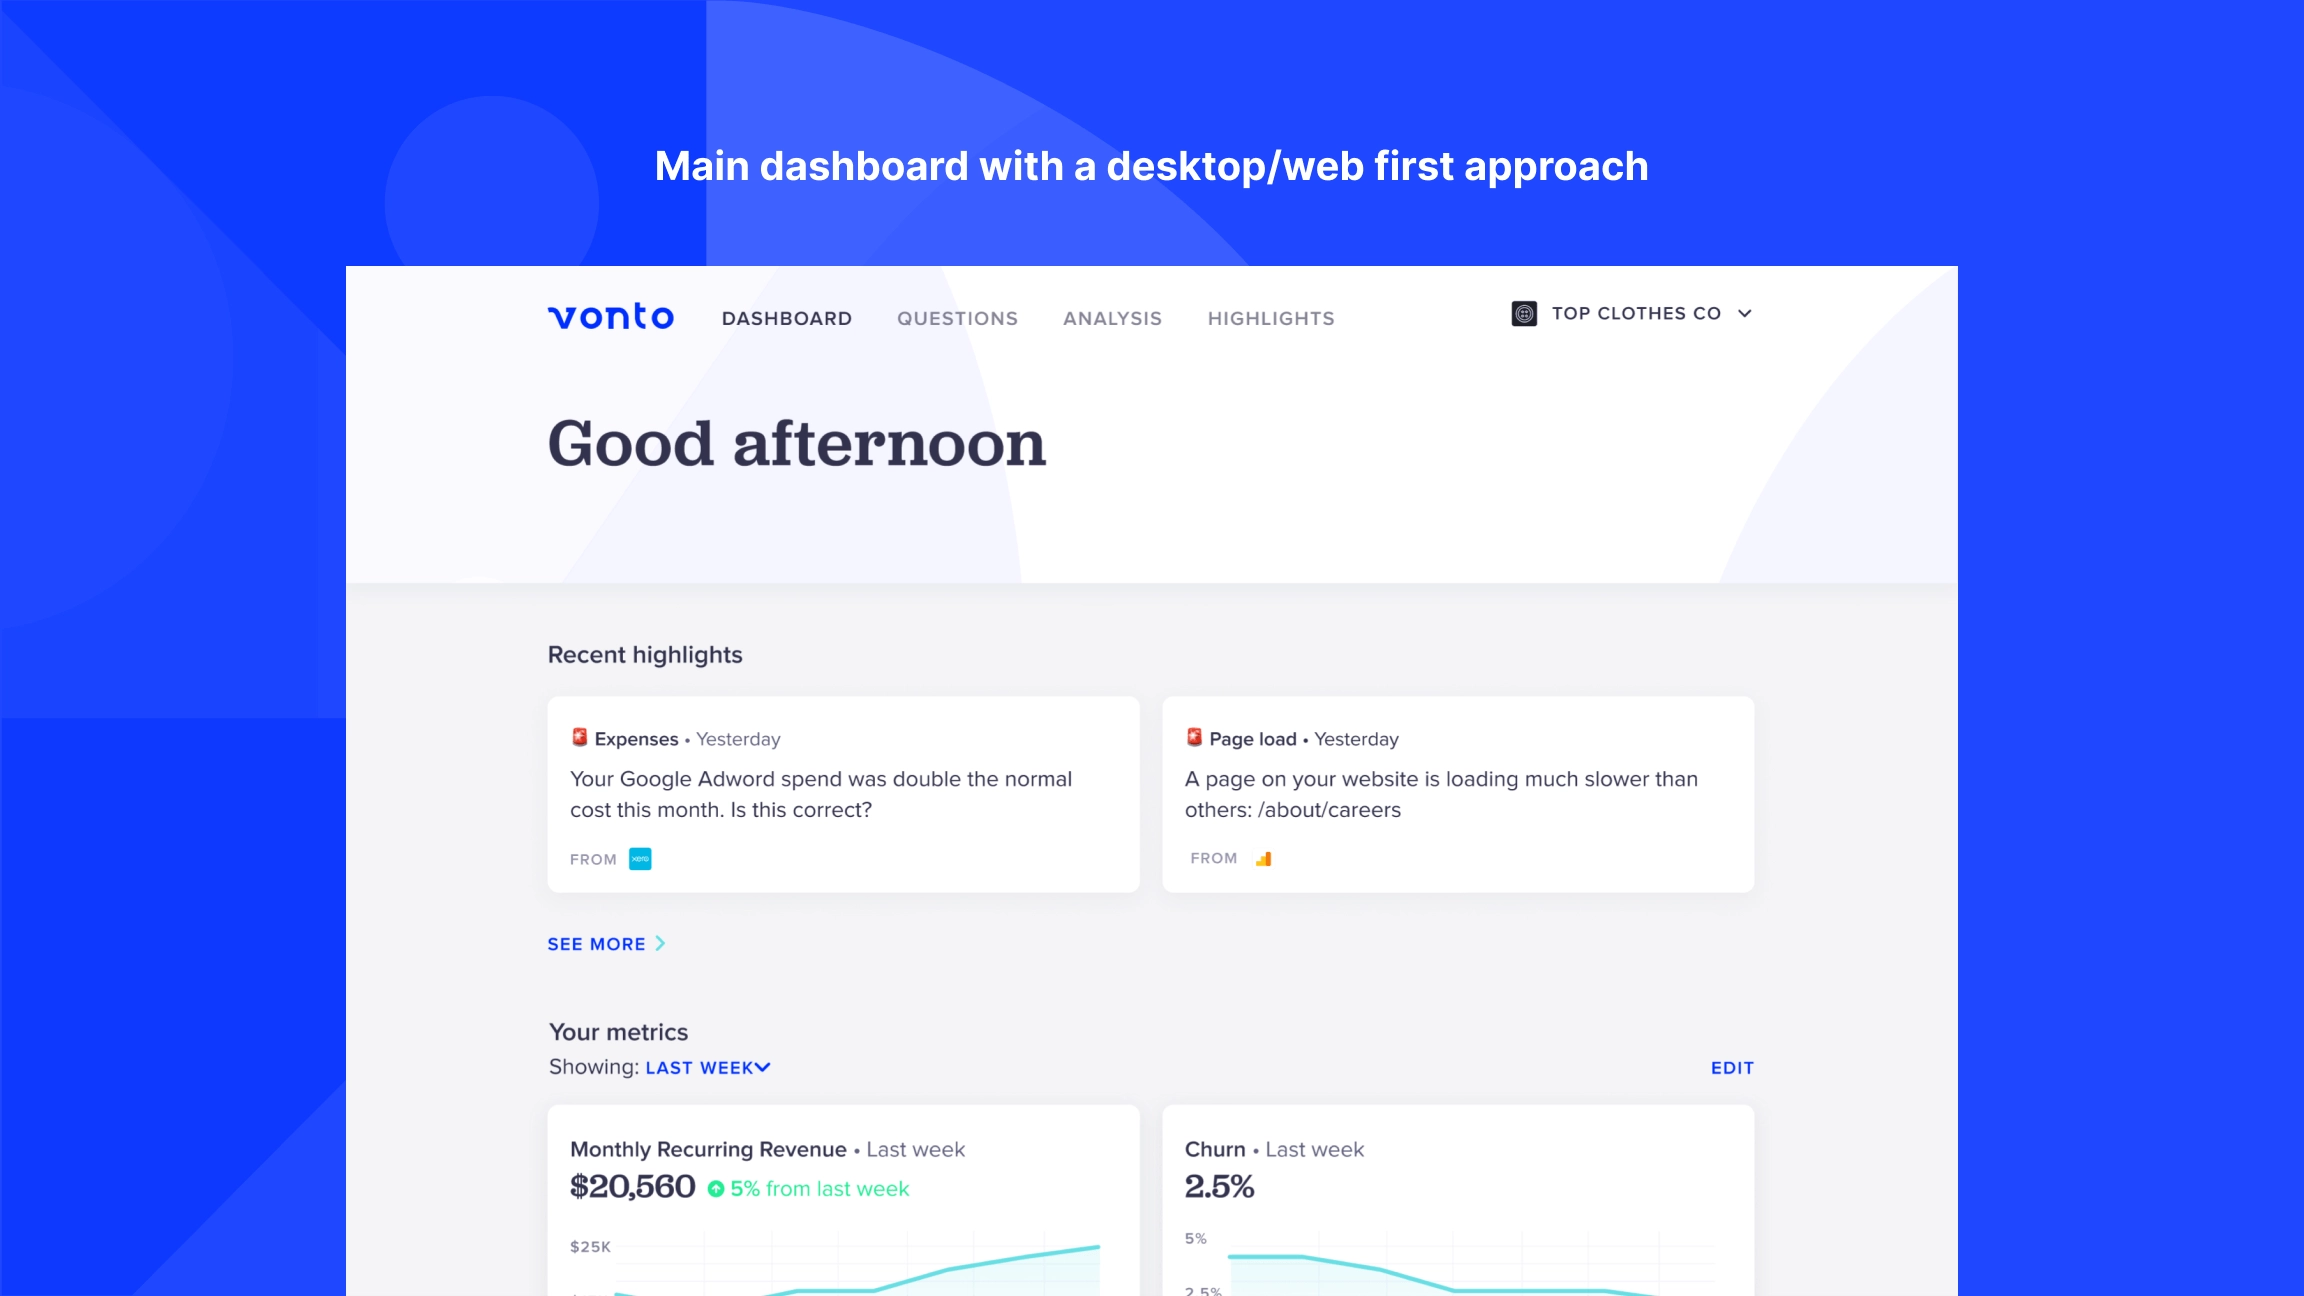
The result was a mobile app that allowed for monitoring of cross-tool metrics, building of simple analyses and a desktop tool for more complex analysis. Prediction and anomaly detection of key metrics helped complete the picture.
The product strategy built on the existing infrastructure: a large library of app integrations; machine learning systems to identify anomalies and predict future financial metrics.


Outcome & lessons
I handed over the project with a validated product direction, design specification, tested prototypes, and product direction recommendations. The Vonto team continued with development and data science necessary to evaluate exactly which unique insights could be generated based on existing integrations.
This project taught me many things:
- Vitamins vs painkillers
A cliche, but obvious here. Our original ideas around aggregating metrics were nice, but not enough to base a product on. - Designing with real data
Initial prototypes used static Figma mocks that didn’t effectively allow us to test the real value of these insights. It wasn’t until we manually created some of these insights for existing users that we got a true understanding of the product value proposition. - Look for latent demand
One of the clearest signal we saw for value, was founders spending hours manually creating these metrics in Excel. It expressed a clear need, while also highlighting clear opportunities: keeping these up to date, guidance and education, anomaly detection.
Retrospective in 2025
Looking back on this project from the world of AI agents & MCPs, this project feels just a couple of years too early. Our ultimate goal of standardising data to surface easy-to-digest insights and explaining them to users is perfectly suited to agents. If only we’d had Claude in 2020.